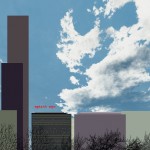
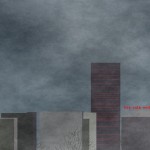
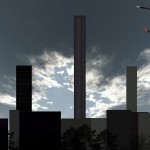
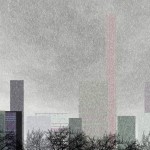
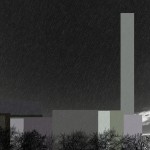
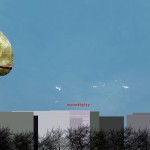
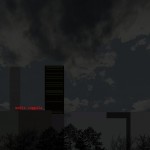
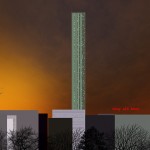
Above: Video documentation of Time In. This project premiered live at Gavin Brown Enterprise at Passerby in New York on the occasion of Culturecounter a show organized by Fernanda Arruda and Michael Clifton featuring Chris Caccamise, Dorota Kolodziejcyk, Jason Meadows Carlo Zanni and Yucef Merhi (february 25th – march 26th 2005)
“Time In” is the first collaboration between artist Carlo Zanni and artist Yucef Merhi. Carlo Zanni and Yucef Merhi hacked into the Time Out New York Magazine Online Queries Database (the one that stores all the queries entered by their website’s visitors) and created an ideal dynamic city to visualize information in constant flux. Live queries shift the scale of skyscrapers every minute while CNN news cover images take the form of choppers and zeppelins and a meteorology station (La Guardia airport) provides info to generate realistic skies. This contemporary networked landscape operates as a visual diagram and social metaphor of a public sculpture, as any urban center is. To become part of this piece, people could access http://www.timeout.com/newyork and type a query.
Time In / tech info
The Sky: The realistic sky changes every 15 minutes, according with the weather picked from a meteo station at the La Guardia Airport recording NYC forecasts. Each time it will be different, generated from a pattern of variables representing a specific weather condition (cloudy, most cloudy, sunny and so on). Also it follows the day-night cycle.
Choppers/Zeppelins: While the shape of the sky changes every 15 minutes, the content of the choppers and zeppelins (randomly appearing almost every 4 minutes) changes as many times as CNN.com updates its website (with breaking news and so on, so world and local news and our social behaviors at large generate the content of the choppers). Basically, chopper frames are cut from the cover image you would find in the CNN.com home page. They are cut using a mask derived from the film “Apocalypse Now” for the choppers, and from the historic LZ-127 Graf Zeppelin, for the zeppelin .
The Buildings: The skyline will change every minute, displaying a new “bar chart” generated out of the data coming from TONY search queries. Flat Fading skylines, coming from TONY database, appear and disappear working as a histogram (each building or skyscraper represent an “x-time” typed query; i.e. tallest buildings represent the most typed queries).
Queries: Green queries popping up between the buildings mean that the work is receiving a live feedback from the TONY website. Red queries will appear when the recorded version is running.
Building windows*:Lines of colored pixels simulating building windows have colors generated from the IP numbers of those users who searched the TONY web site. An IP is a code formed by four numbers, identifying the Internet connection of a computer. Our code takes the last 3 numbers of each IP to generate a color following the RGB (red-green-blue) scheme.
*only in second and third month
Trees: lines of trees are randomly generated each minute selecting among choice of nine trees.
———————————————————————–
Code and Executive Engineering: Carlo Giordano
